What is the Traceroute Command in Linux?

Quick Definition: Traceroute is a Linux command-line utility used to trace the path network packets take from the source to a destination host or IP address.
Have you ever been stuck trying to troubleshoot or diagnose a bad network connection on a Linux system? Luckily, there is a highly effective tool built into most Unix and Linux systems that makes easy work of basic network connectivity checks: traceroute.
The traceroute command is one of the most widely used tools for network troubleshooting and diagnostics in Linux, and it's really easy to use once you know the basics. The traceroute command, along with the similar tracepath tool, provides an invaluable view of the route your network’s traffic follows.
Understanding traceroute is key for any Linux system administrator or network engineer who needs to quickly perform tests and get comprehensive results in a few seconds. Join us as we show you how it works and how you can use it yourself.
How Does Traceroute Work?
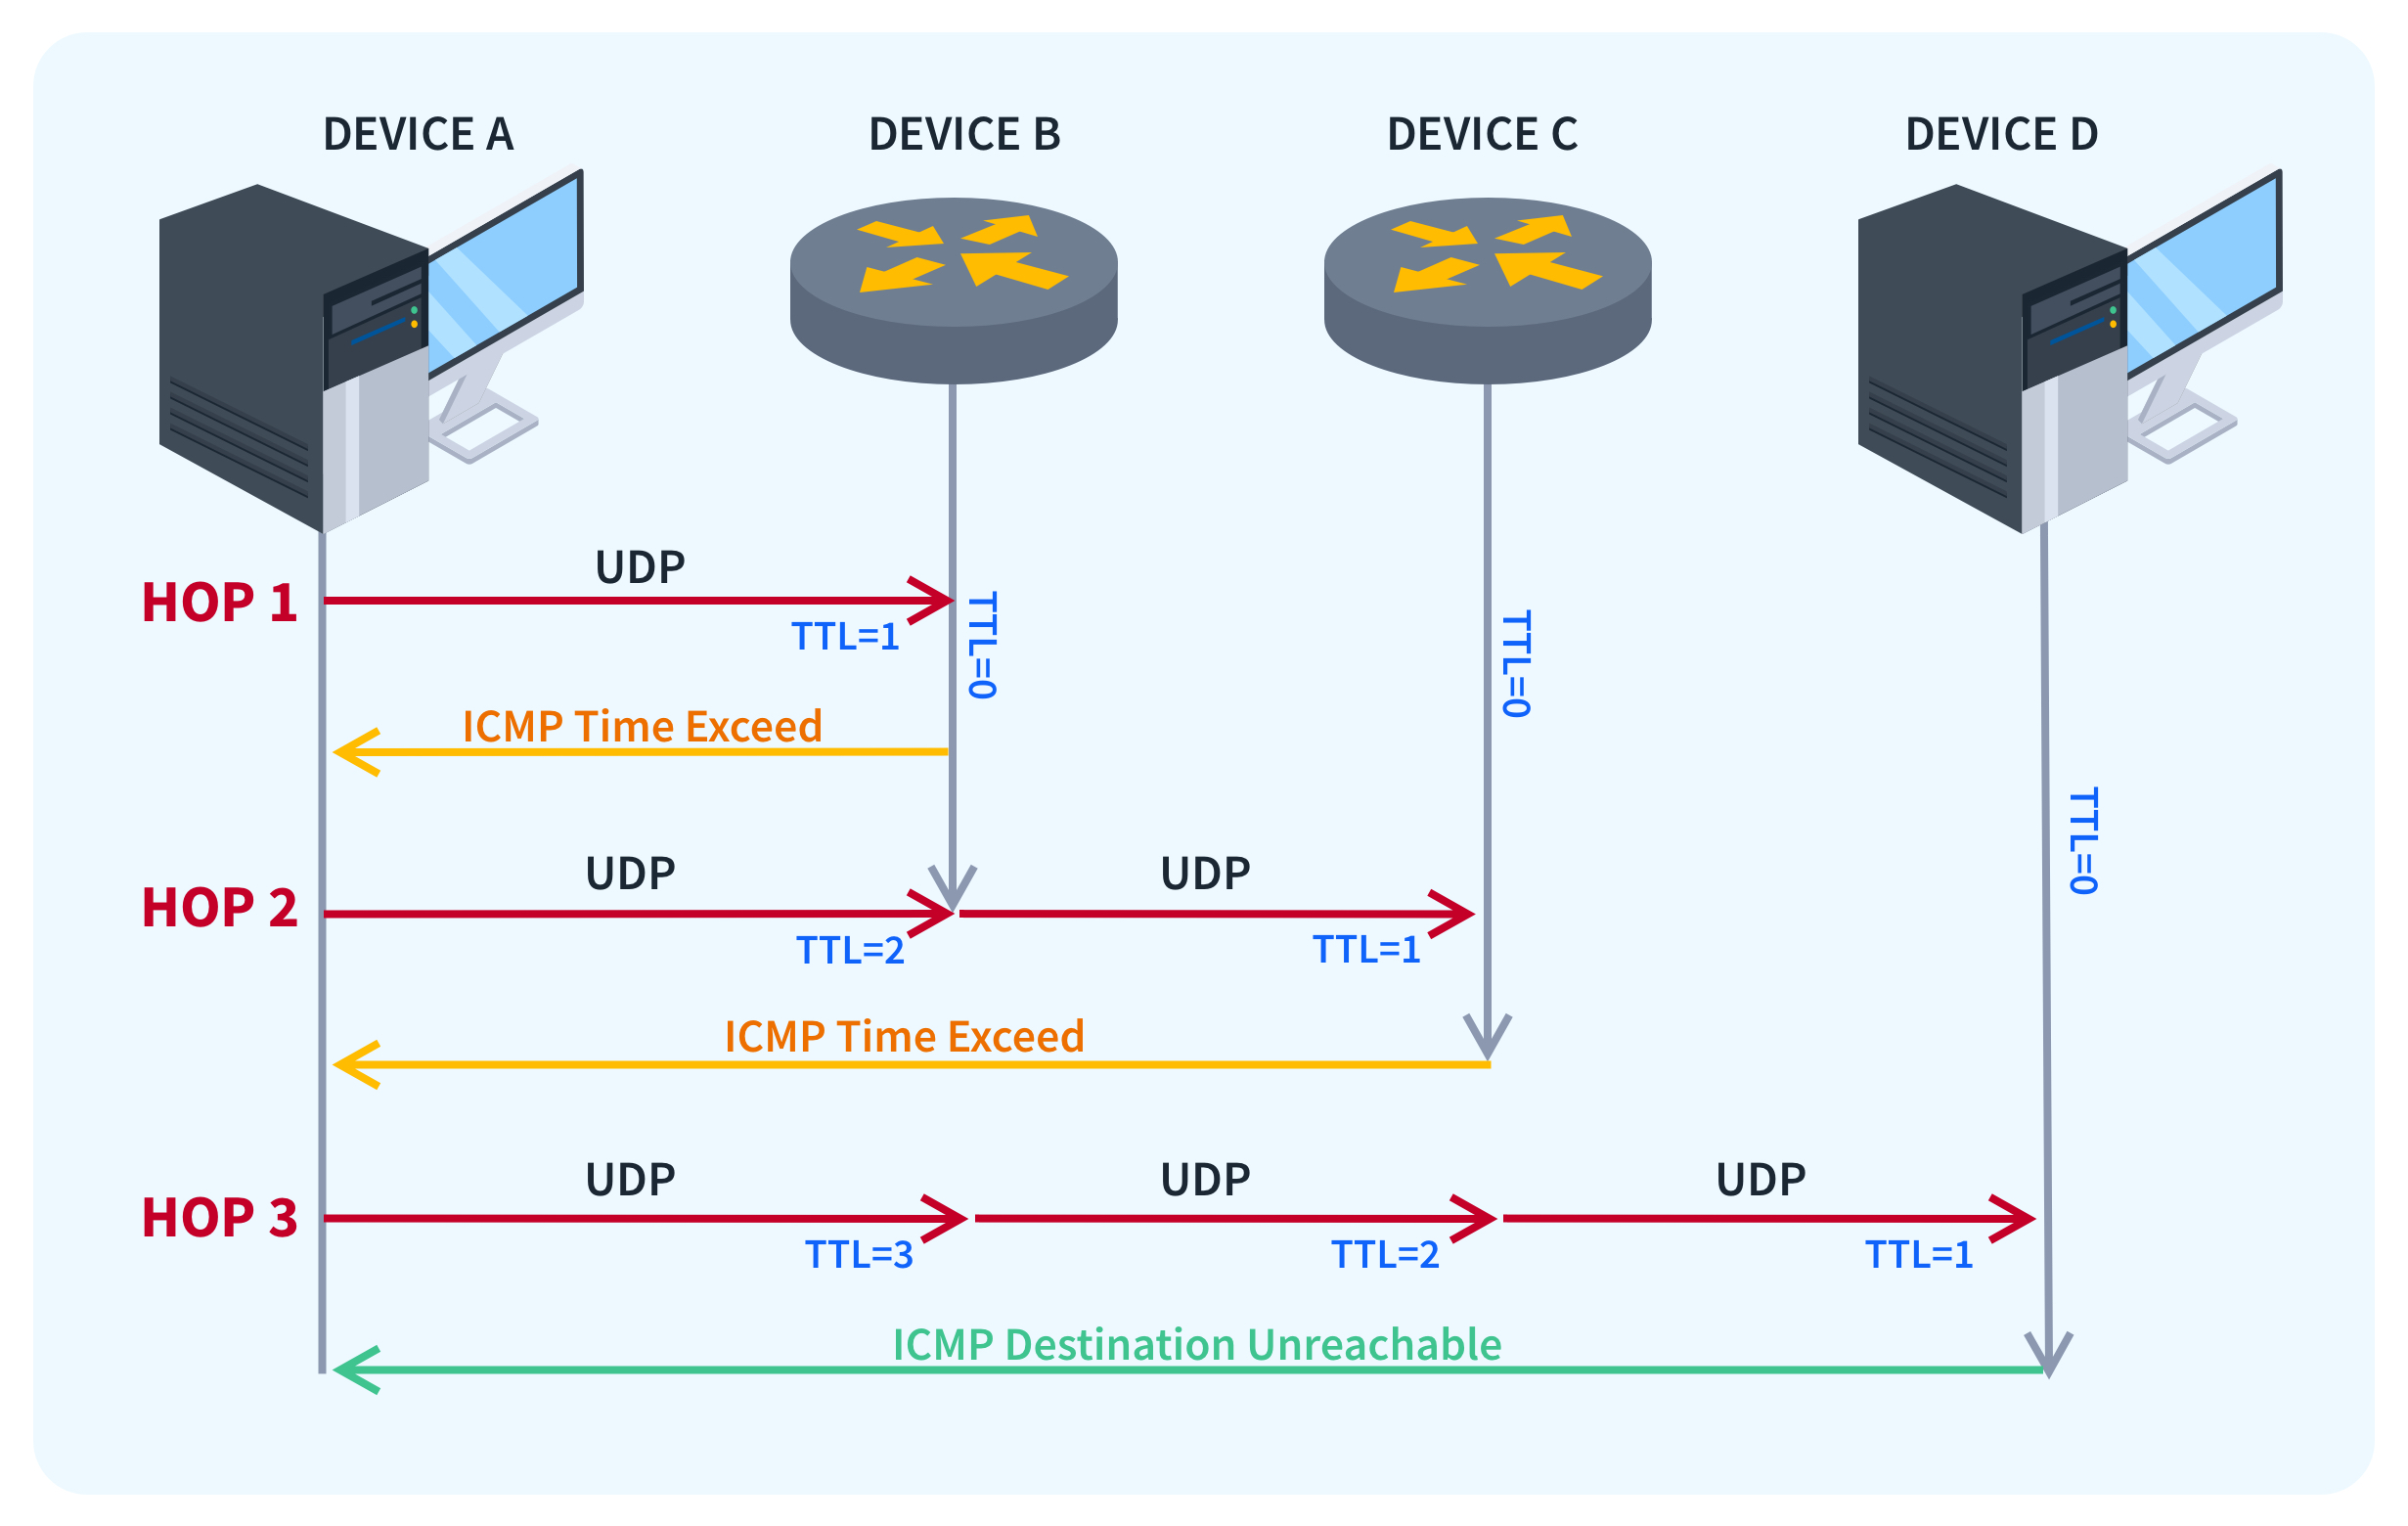
Traceroute command performs its diagnostic magic by sending ICMP echo packets, also known as ping packets, with increasing TTL (Time To Live) values. It initially starts with a TTL of 1, so the first router receives the packet, decrements the TTL to 0, and drops the packet while sending an “ICMP time exceeded” message back.
Going forward, traceroute increments the TTL for each packet that it sends. This means the next router that receives these packets then decrements the TTL down to 0 and then also returns the time-exceeded message. This continues right up until the packet reaches the destination host being tested. Along the way, traceroute records each hop and provides the hostname, IP address, and round-trip time for each one.
This maps out the path the packets take to reach the destination, giving us a better idea of the route taken to get there. It identifies all routers in between, which can help pinpoint network latency and bottlenecks, and sometimes even failed devices where the packet stops dead in its tracks.
How to Use Traceroute
Perhaps the greatest benefit of using traceroute on Linux is that it is very straightforward and comes preinstalled on almost all distros. If you would like to try it out for yourself, here are some basic steps for you to follow:
Open a terminal window
Type traceroute followed by the destination IP address or hostname
For example:
traceroute www.google.comThis will trace the route to Google's server and tell you how many hops were taken and how long it took.
You can also specify options like:
-n to disable hostname lookup and display IP addresses only
-w to change the timeout waiting for response
-m to specify the max TTL (max number of hops)
For example:
traceroute -n -w 2 -m 15 www.google.comThis traces the route to Google's IP, sets the timeout to 2 seconds, and limits it to 15 max hops.
How to Interpret Traceroute Results
The output of traceroute provides important information:
Hop Number: The order of routers on the path to the destination, which starts at 1.
IP Address and Hostname: The IP address and hostname (if resolved) of the router at that hop. This is helpful when you need to identify a potential suspect device that could be causing your network problems.
Response Times: The time in milliseconds it takes to receive a response from that hop, which helps identify latency if you are experiencing poor response times.
For example:
traceroute to www.google.com (172.217.4.36), 30 hops max, 60 byte packets
 1  10.0.0.1 (10.0.0.1)  2.382 ms  2.432 ms  2.522 ms
 2  192.168.1.1 (192.168.1.1)  12.239 ms  12.544 ms  14.036 ms
 3  172.217.4.36 (172.217.4.36)  23.312 ms  24.544 ms  25.612 ms
This shows a 3 hop path to reach Google's server. We can see the local router IP, the next hop shows a router’s IP, and finally Google's IP address. The increasing response times indicate potential latency issues between hops 2 and 3, which could be the cause of an issue if you came across an increase in latency like this when testing.
How to Troubleshoot with Traceroute
Some common network issues that traceroute can help you to identify:
High latency at a particular hop: This could indicate a slow router with poor performance, allowing you to see exactly what is happening on the network route.
No response from a hop: When this happens, it is usually a routing issue or firewall blocking ICMP. With traceroute results, you can log more accurate support tickets or pass information on to your networking team, saving time and getting issues resolved more quickly.
Missing hops: This sometimes indicates that routing is misconfigured or unstable on a path, which is useful information if you are diagnosing a potential fault with your internet or network provider.
Long routes: If you are seeing excessive hops to your destination, then you might be dealing with suboptimal routing, leading to increased response times and poor network performance.
You can troubleshoot network issues with traceroute results to help:
Quickly identify problematic routers based on high latency or packet loss.
Verify routing tables on routers along the path because misconfigured routing tables may not decrement the TTL field.
Verify ACLs and firewall rules if packets are blocked along the path.
Advanced Traceroute Techniques
Here are some additional tips for utilizing traceroute:
Port and Protocol Troubleshooting
If you are seeing connectivity issues, then traceroute is very helpful for identifying the protocol or port being blocked by seeing probes fail using TCP or a specific port. You can do this with the following command:
traceroute -T -p [port number] [destination host](-T tells traceroute to use TCP, and -p specifies the port number)
Load Balancing Accuracy
If you suspect load balancing is showing inaccurate paths, then you can get more accurate results by increasing queries per hop. You can increase the packets sent per hop with the following command:
traceroute -q 5 [destination host]Protocol Path Analysis
Seeing routing differences between protocols like ICMP, TCP and UDP with different command parameters:
-I specifies ICMP
-T -p specifies TCP and the port number
UDP is used by default.
MTU Troubleshooting
Analyzing layer 3 MTU issues by reducing probe packet size and seeing where fragmentation occurs is useful when used in conjunction with the ping command.
Best Practices for Using Traceroute
Follow these best practices when using traceroute:
Find the right fault: To identify an issue properly, it is usually best to run traceroute tests regularly to establish a baseline of normal routes for a given destination.
Understand what you are looking at: Monitor the results you get and be sure to set appropriate timeouts -w to avoid false readings.
Keep a lookout for DNS problems: Watch for DNS issues if names don't resolve.
Understand the limitations of traceroute: Take into account ACLs and firewalls that block ICMP on the network, as this can look like network equipment issues if you don’t realize some devices simply don’t respond by design.
While traceroute is powerful and very useful, it does have limitations depending on the network you use it on. As with most utilities and tools, use traceroute as part of an overall troubleshooting process for a wider picture of where issues lie.
Conclusion
The traceroute command provides an invaluable view of the route your network’s traffic follows across both your network and the internet. It is one of the first steps in identifying connectivity issues and network latency, and it is very easy to use once you understand what you are actually measuring.
Mastering the proper use of traceroute provides a critical advantage in troubleshooting network performance problems and outages. As far as network troubleshooting abilities are concerned, learning how to use traceroute is an elementary skill that will help you identify network issues quickly, which speeds up your troubleshooting and diagnostics.
Not a CBT Nuggets subscriber? Sign up for a 7-day free trial.
delivered to your inbox.
By submitting this form you agree to receive marketing emails from CBT Nuggets and that you have read, understood and are able to consent to our privacy policy.
