Article

Comparison Failure and Successful Methodologies for Diffusion Measurements Undertaken inside Two Different Testing Rooms

1
Department of Architecture, University of Bologna, 47521 Cesena, Italy
2
Department of Industrial Engineering, University of Parma, 43124 Parma, Italy
3
CIRI-Interdepartmental Centre for Industrial Research in Building and Construction, University of Bologna, 40132 Bologna, Italy
4
Techno Srl, Via Pirano 7, 48122 Ravenna, Italy
*
Author to whom correspondence should be addressed.
Appl. Sci. 2021, 11(22), 10523; https://doi.org/10.3390/app112210523
Submission received: 22 September 2021 / Revised: 4 November 2021 / Accepted: 4 November 2021 / Published: 9 November 2021
(This article belongs to the Special Issue Acoustic Properties of Absorbing Materials)

Abstract

:
The scattering phenomenon is known to be of great importance for the acoustic quality of a performance arts space. The scattering of sound can be achieved in different ways: it can be obtained by the presence of architectural and/or decorating elements inside a room (e.g., columns, statues), by the geometry and roughness of a surface (e.g., Quadratic Residue Diffuser (QRD)) and by the diffraction effect occurring when a sound wave hits the edges of an obstacle. This article deals with the surface scattering effects and the diffusion phenomenon only related to MDF and plywood panels tested by disposing the wells both horizontally and vertically. The test results undertaken inside a semi-reverberant room and inside a large reverberant room have been compared to highlight the success and the failure of the measuring methodologies. In detail, according to the existing standards and regulations (i.e., ISO 17497—Part 2), diffusion measurements have been undertaken on a few selected types of panel: two QRD panels (made of Medium Density Fiberboard (MDF) and plywood) with and without a smooth painted solid wood placed behind the QRD. The panels have been tested inside two rooms of different characteristics: a semi-anechoic chamber (Room A) and a large reverberant room (Room B). The volume size influenced the results that have been analyzed for both chambers, showing an overlap of reflections on panels tested inside Room A and a clear diffusion response for the panels tested inside Room B. In terms of the diffusion coefficient in all the octave bands between 125 Hz and 8 kHz, results should not be considered valid for panels tested in Room A because they were negatively impacted by extraneous reflections, while they are reliable for panels tested in Room B.

1. Introduction

The acoustic properties of surfaces are essential to estimate and calculate sound propagation within an enclosed space [1,2]. The acoustic scattering from surfaces and sound absorption characteristics are very important in all aspects of room acoustics, e.g., in opera houses, concert halls, industrial workplaces and reverberation chambers.
The sound scattering mechanism is activated by the corrugations of the walls with a sufficiently rough structure or by single elements such as columns, statues, etc., or by diffraction effects along the edges of panels. For example, concert halls or theatres could present focalization of the sound, so diffusing panels are inserted to solve this problem [3,4]. Many measurement methods have been developed to quantify the various types of sound scattering coefficients and to determine the sound diffusion mechanisms. For many years, acoustical surface scattering has been deeply studied by researchers worldwide [5,6,7], and its standard definition is the ratio of the energy reflected outside the specular zone to the total reflected energy.
Cox suggested quantifying the diffusion by means of the standard deviation of the reflected energy distribution [8,9]. A similar approach was proposed using a new diffusion uniformity coefficient based on the circular autocorrelation function of the polar reflected energy diagram [10,11]. Moreover, different techniques depending on the type of incident sound field (free field or diffuse field) were proposed to measure the sound scattering coefficient [12,13]. Contrastingly, the Audio Engineering Society (AES) proposed a measuring technique of the diffusion uniformity coefficient [14].
Continuous studies in this field [15,16] brought the introduction of the standards ISO 17497-1:2004 [17], which refers to the measurement of the random-incidence scattering coefficient, and ISO 17947-2:2012 [18], which refers to the measurement of the directional diffusion coefficient.
In this paper, two diffusion measures are introduced with somewhat different applications. One measure was performed in a semi-anechoic chamber (Room A) and the second in a large reverberant room (Room B). To determine the sound diffusion coefficient, two QRD panels made of different materials were tested following ISO 17947-2:2012 regulation. The success and the failure of the measuring methodologies being used are highlighted by the contribution of extraneous reflections recorded inside Room A that compromised the scattering results, which have been discarded because they were considered to not be affordable values. The results of the panels tested inside Room B instead have been compared with the reference curves of a theoretical model based on the principle of free field sound propagation, while data analysis consisted of a polar distribution of the scattered field through the use of the Fast Fourier Transform (FFT).
This concept could be extended to the correct architectural design of a room with regard to the purpose of its appropriate use that sometimes, in the context of cost reduction, is wrongly used for other types of sound tests by facing unexpected objectives.

Literature Review

Summarizing the two parts of the reference standard, the method detailed in part 1 of ISO 17497 is focused on measuring the random-incidence scattering coefficient based on the degree of roughness of the tested surface, while the method described in part 2 of the same standard is focused on measuring the diffusion coefficient of a surface based on the angle of the incident ray. For the panels selected for this paper, the method described in ISO 17497:2012 part 2 has been adopted, specifically in two non-anechoic rooms of different volume sizes.
The methodologies of ISO 17497 have been revised firstly by Mommertz and Vorlander, who developed the free-field scattering measurements [15]. Outcomes of this research were the assessment of the absorption coefficient for each frequency band, after an FFT post-processing of the measured RIR obtained by rotating the panel at 5° steps on 72 angles, and thereafter the evaluation of the scattering coefficient of the reflected sound.
Other practice experimentations were identified in the wave field synthesis (WFS) approach by Farina [19], who characterized the scattering properties of a generic, finite-size object by a large number of RIR measurements taken by moving the microphone at small steps along a straight line instead of following the trajectory of a hemi-circumference. Since the scattered wavefronts have more curvature than the specularly reflected ones, the WFS has been adopted because it can easily separate the two types of wavefronts. With this technique, the estimation of the scattering coefficient is obtained by minimizing the difference between the numerical calculations and the measured results.

2. Technical Description of the Two Types of Diffusers

In acoustics, different types of material and geometry applied to the diffusers have been exploited and developed since the pioneering studies and research conducted by Schroeder in the 1970s [8]. A common purpose of all the diffusers is to spread the sound waves into all directions, trying to reduce the strength of the undesired specular reflections or echoes, while the sound energy remains preserved in the space [20].
Among the wide variety of panels (differing by material, shape, geometry, etc.), the selected types of diffusers treated in this article are the following:
  • Two Quadratic Residue Diffusers (QRD), varying in material component (i.e., MDF, plywood) and used in the horizontal and vertical configuration of the grooves;
  • A smooth painted reflecting panel was used as the backing of the QRDs.

2.1. The Quadratic Residue Diffusers (QRD)

The spatially dependent reflectivity for the QRD follows the numerical sequences with a uniform spatial Fourier transform of their reflection coefficient.
The phenomenon of diffusion started to be studied extensively in 1975 by Schroeder [8], who provided a way of designing highly diffusing surfaces based on binary maximum-length sequences showing that these periodic sequences have equal harmonic amplitudes.
Later on, he extended his method and proposed surface structures that give excellent sound diffusion over larger bandwidths. Specifically, this kind of diffuser is composed of a periodic sequence of grooves having the same length and different widths. The maximum width is given by the maximum wavelength to be diffused, while the width of every groove is determined by the dimension of half-wavelength to be diffused. The depth of the sequence is determined by Equation (1).
d = n 2 · m o d ( p )
In this case, n is an integer number, p is an odd prime number and m o d ( ) is the operator modulus. By the input of these two variables, it is possible to determine the depth of the diffusing panel by the relationship of the maximum depth (dmax) and the maximum number of the sequence (nmax), as summarized in Equation (2).
d = d m a x n m a x
Scientific studies [8] confirm that the limits for the effectiveness of the quadratic residue diffusers are in function of the wavelength and, thus, of the frequency. Below the lowest effective frequency, the diffuser works as a flat panel because the sequences are too small to be influencing the incident sound wave, having no scattering effect. In fact, the typical thickness of the QRD is half of the wavelength, corresponding to the low cut-off frequency.
In a similar way, above the highest effective frequency, the wave propagation becomes irregular and it cannot be considered a plane wave. The lower and upper limits are defined by Equations (3) and (4).
λ m a x = 2 p d m a x n
λ m i n = 2 w
The input data for the measurements presented in this paper are as follows:
  • p = 17 for the horizontal sequences;
  • p = 13 for the vertical sequences.
The dimensions of the panels tested are 900 × 600 mm [L × H], as shown in Figure 1. The same dimensions are valid for both MDF and plywood materials.
The choice of the p numbers falls on the maximum efficiency of the panel to be comprised between 250 Hz and 2 kHz.

2.2. Reflecting Panel

A painted solid wood panel has been used as the backing of the QRDs during the measurements. It is not perforated and presents a smooth surface having dimensions of 900 × 900 mm [L × H]. Measurements were undertaken with and without this reflecting panel, in order to obtain absolute values of the QRDs in their configuration and to simulate the applications of the QRDs in specific environments such as auditoria, theatres, recording studios, or conference rooms.

3. Measurements and Methodology

3.1. Standards and Regulations

3.1.1. Methodology in Line with ISO 17497: 2004+A1:2014, Part 1—Measurement of Random-Incidence Scattering Coefficient in a Reverberant Room

Part 1 of the ISO 17497 deals with the method for measuring a random-incident scattering coefficient by describing the number of reflections deviating specularly from a surface. The frequency range of the measurements is comprised between 100 Hz and 5 kHz, in third-octave bands. The test should be undertaken in a reverberant room (as fully described in ISO 354:2003 [21]) such that the absorption (A) inside the testing room should not exceed A ≤ 0.3 × V2/3.
The test sample fixed to a rigid base/plate is rotated by a turntable mechanized system. The plate where the sample is fixed should be symmetrical with respect to the axis of rotation and should have a size corresponding to the maximum dimension of the test sample.
The test sample should be circular or flush-mounted, having a surface area as large as possible in order to obtain a good measurement accuracy. It is recommended that the sample structural depth should be small compared to the size of the surface to be tested, it should be hd/16, where d is the diameter of the turntable. Another condition to be considered for the test sample is that the random-incidence absorption coefficient should not exceed αs = 0.50.
Procedures for the measurement methodology should follow the ISO 18233:2006 [22]. The room impulse response (RIRs) should be measured without and with the test sample accordingly with the ISO 354, with two source positions and three microphone positions at least. The duration of the measurement should be equal to the time that the turntable employs to make a complete revolution. Measurement should be taken with and without the test sample, in static and rotating turntable conditions, for a total of four different settings.

3.1.2. Methodology in Line with ISO 17497:2012, Part 2—Measurement of the Directional Diffusion Coefficient in a Free Field

Part 2 of the ISO 17497 deals with the method for measuring the directional diffusion coefficient by describing the uniformity of the reflected polar distribution, best known as the quality of the diffusing surface.
The diffusion coefficient describes the energy reflected by a surface, which is spatially distributed by the description of a polar response. For this methodology, the microphones are positioned radially in front of the test sample. The frequency range is the same used for the turntable method, comprised between 100 Hz and 5 kHz in third-octave bands.
The environment of the measurements should be an anechoic chamber or a large semi-reverberant room simulating the reflection-free environment. It is recommended that the RIR should be taken in the far-field for monitoring the achievement of the amount of diffusion and use the near field for any aberration or focusing effect.
In relation to the measurement procedures, at least 80% of the receiving positions should be outside of the specular zone in order to meet the far-field conditions and the distance between the source and the test sample should be 10 m, while the receivers’ radius should be 5 m. The receiver angular resolution should be of a maximum of 5°. Regarding the equipment, the sound source should be omnidirectional, emitting the sound signal as described in ISO 18233:2006, while the microphones should have the same sensitivity to all the conceivable reflection paths.
The measurements should be undertaken without and with the test sample. The polar response processing is based on the isolation of the reflections given by the test sample from other types of reflections (e.g., room boundaries). The influence of background reflections shall be removed through windowing the RIR. If the window is set with a unity gain where the reflections are present and zero elsewhere, the residual reflections will be removed. The windowed RIR shall then undergo the Fourier transformation in each frequency band of interest.

3.2. Real-Scale Room Models and Instrumentation

Two measurement campaigns were conducted in two real-scale rooms selected for testing the diffusers and described as follows:
  • A semi-anechoic room having dimensions 9 × 10 × 4.5 m [L × W × H] (Room A), one of the facilities of the SCM Group located in Rimini. This room has a hard finish floor and absorbing panels applied on walls and ceiling.
A reverberant room having dimensions 16 × 20 × 7 m [L × W × H] (Room B), one of the laboratory facilities of the University of Parma. This room has hard material as a finished floor, plastered bricks on walls and an exposed concrete slab. Volume size is considered big enough to ensure the condition of a free field. The equipment used for the acoustic measurements is composed of the following items:
  • An equalized loudspeaker (Genelec 8351 SAM), Finland;
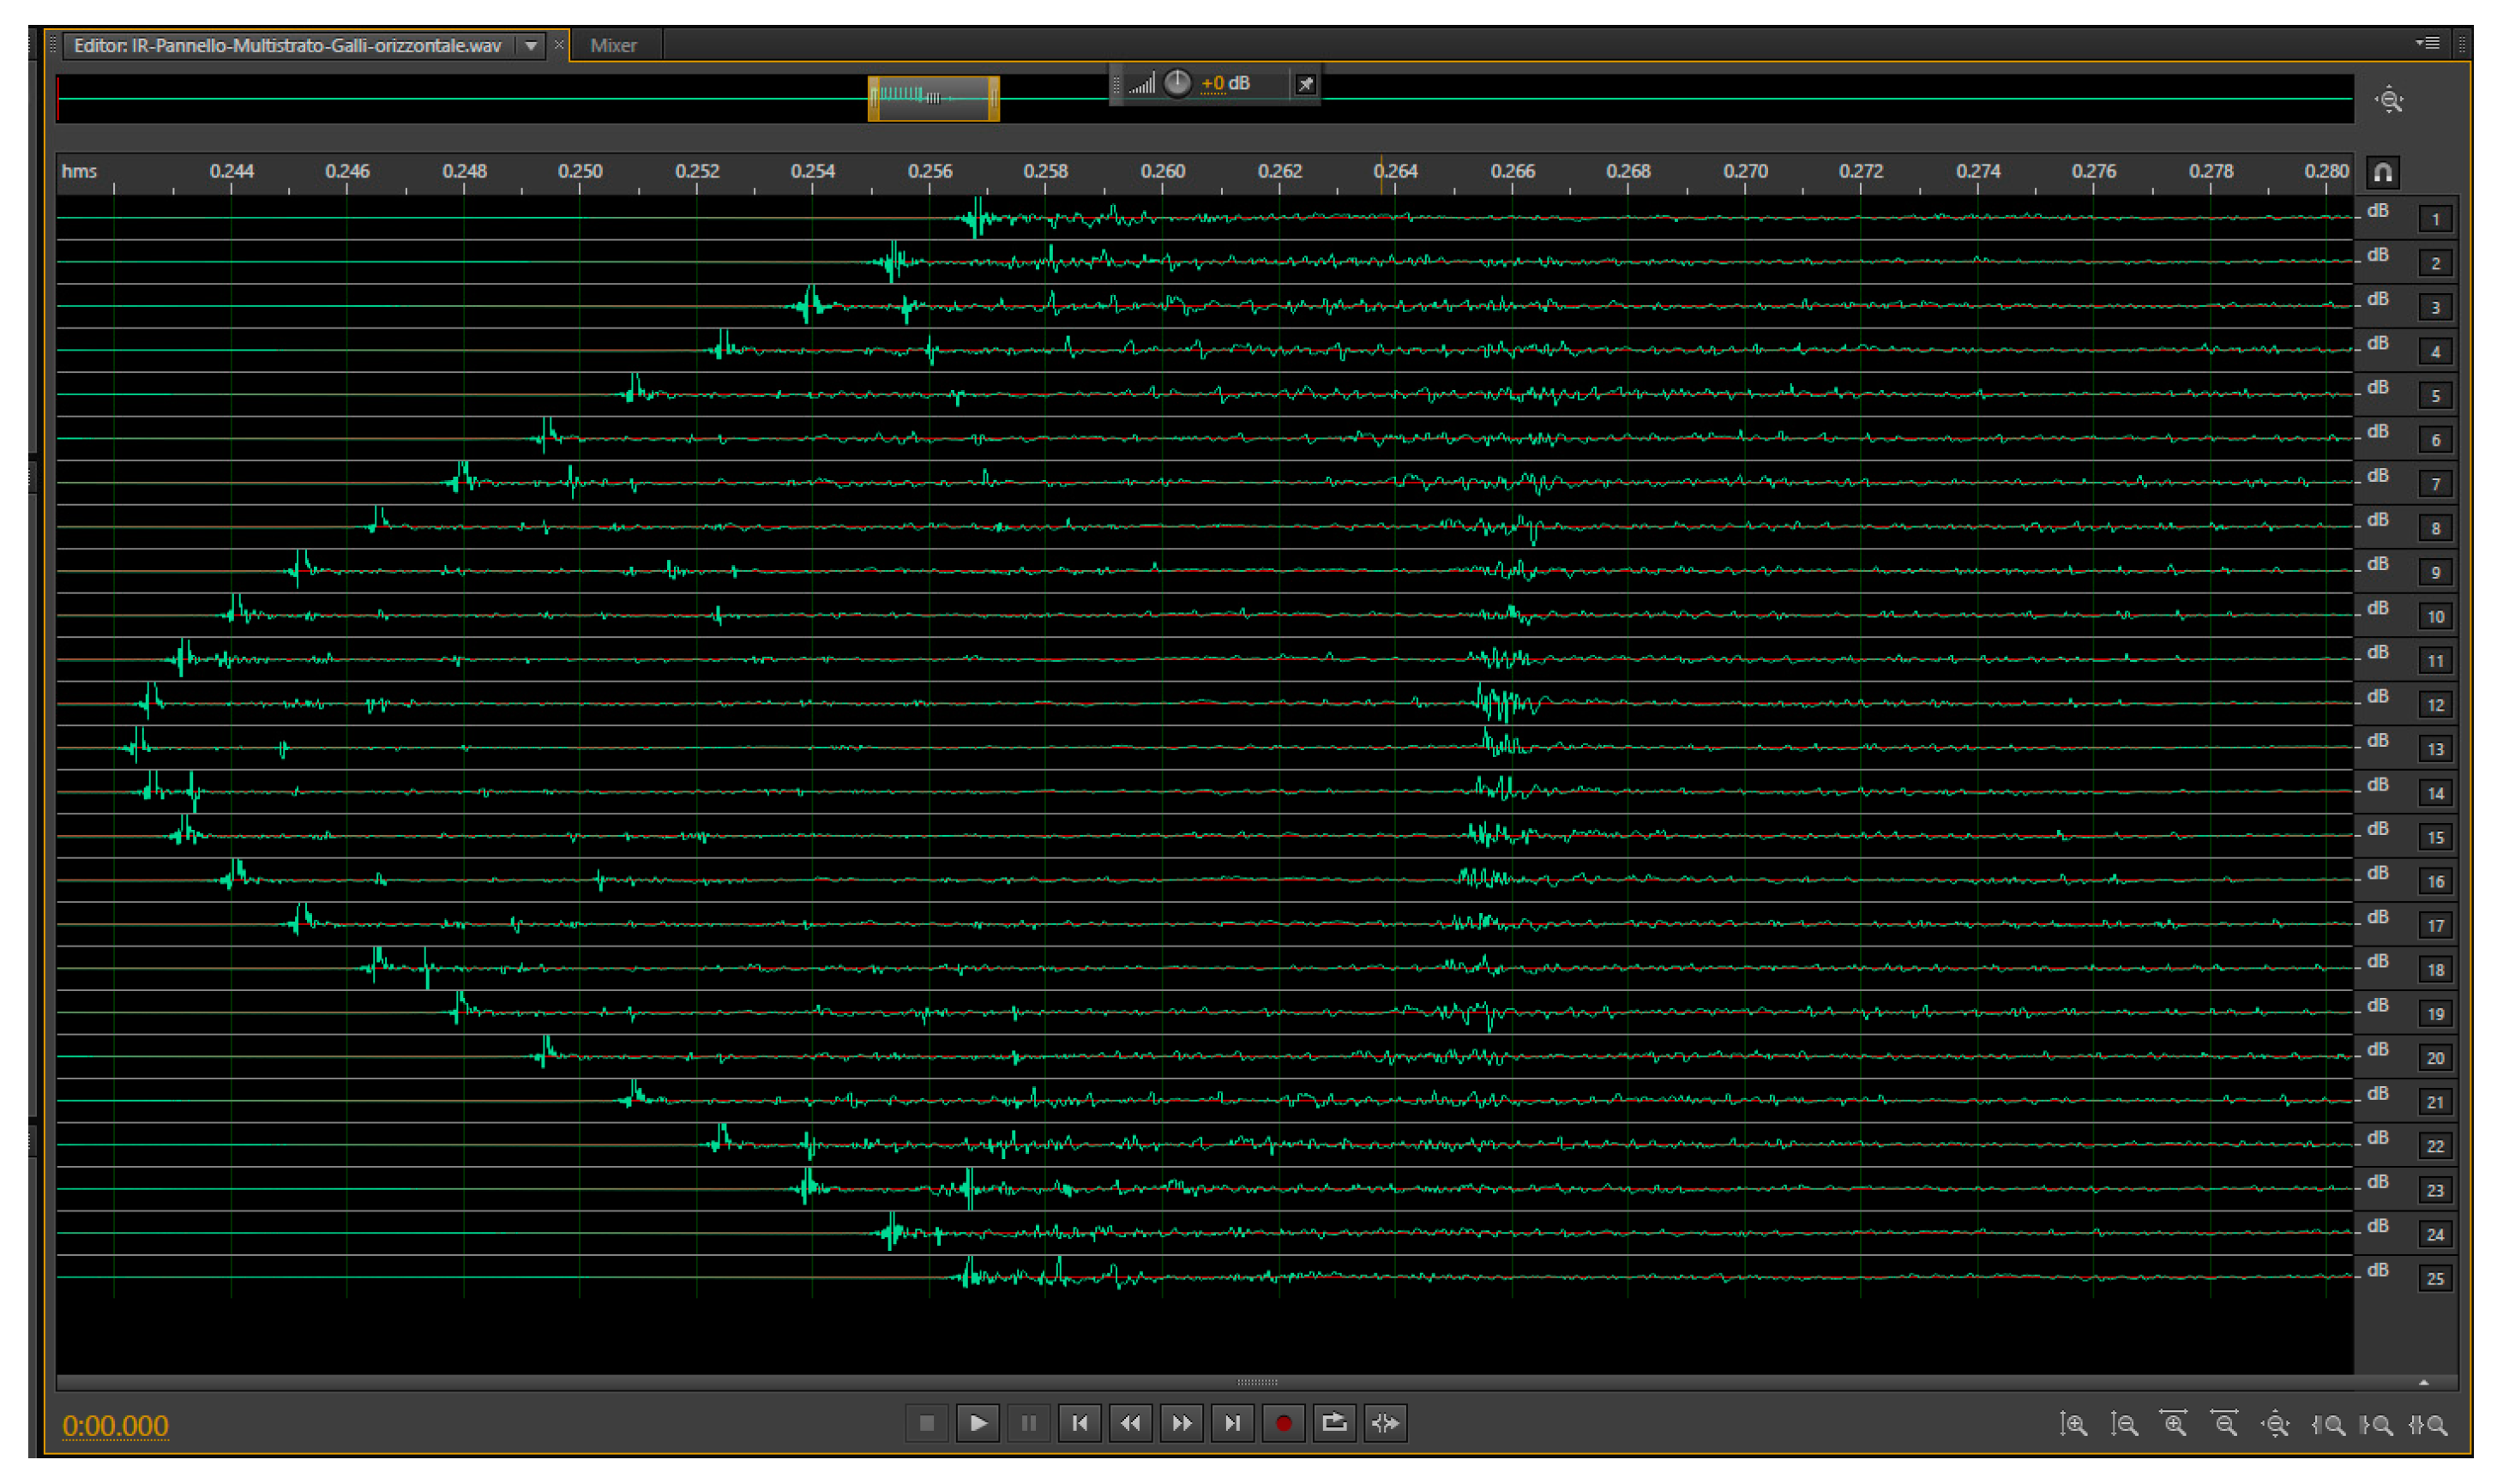
  • 25 microphones pre-polarized for free field conditions (B&K 4188), Denmark;
  • 8 converters for data acquisition (Behringer ADA-8000), Germany;
  • Firewire interface M-Audio (Profire Lightbridge), USA.
MacBook Pro 15”. Because the diffusion coefficient indicates how the quantity of the reflected energy is distributed in space, both sound source and receivers were placed in a certain way to determine the spatial distribution of the polar response of the reflected sound. In particular, 25 microphones were positioned at a constant radial distance from the sound source, recording the one-third-octave bands between 100 and 5 kHz. The anechoic conditions for investigating the panels’ early reflections were obtained by setting the microphones at floor level to prevent receivers picking up waves reflected from the floor, which would distort the measurements.
The conditions of the experimental measurements followed the rules of the far-field, by having 80% of the receivers out of the specular zone. In this research, the sound source was located only in front of the sample. The methodology for measuring the diffusion coefficient used during the two campaigns followed ISO 17497, part 2.
The disposition of the instrumentation was different between Room A and B. In particular, inside Room A, given the limited dimension of the space, the 25 microphones were installed at a radius of 4 m from the test sample, which was located at the center of a virtual semi-circumference, and the sound source was at a radius of 8 m distant from the test sample, as indicated in Figure 2.
Differently, in Room B the 25 microphones were installed at a radius of 5 m from the test sample, always located at the center of the semi-circumference, and the sound source was at a radius of 10 m distant from the test sample, as indicated in Figure 3.
The excitation signal employed for the RIR was an exponential sine sweep (ESS), having a frequency range set between 40 Hz and 20 kHz. In each room and for each panel configuration, the measurements were repeated three times with a silence gap of 5 s in between.
The size of the speaker was big enough to cover the diffuser dimensions, while all the microphones were set to have the same sensibility for any reflection going from the diffuser to the receivers, with a drift of ± 1 dB.
The sets of measurements were undertaken to capture the 25 RIRs with and without the test sample.
The type of diffuser utilized for this experiment was a single plane, having an acoustic impedance constant along the x-axis. On this basis, the diffusion coefficient can be measured on a plane orthogonal to the direction x, calculating the maximum diffusion.

3.3. Tests Performance

In each room, different configurations of the QRDs have been tested, with and without the backing reflecting panel. Table 1 summarizes the test configurations.

4. Data Analysis and Post-Processing

Data analysis has been realized by using the software Adobe Audition CC, which illustrates contemporarily all the RIRs given by the 25 microphones, as reported in Figure 4 and Figure 5.
Both Figure 4 and Figure 5 illustrate the direct sound recorded by all the microphones, as shown in a hyperbolic shape on the left of the screen. Based on the geometrical organization of the microphones, channel 13 is the closest to the sound source and hence it represents the first receiver recording the signal. As long as the other microphones are equidistant from the source (located symmetrically with respect to the main axis crossing the sound source, microphone 13 and the sample), the direct sound is recorded with a variable time delay, slightly increasing towards the extreme microphones (i.e., channel 1 and 25).
The main characterization factor between the analysis undertaken for Room A and B is the reflected signals. In particular, for Room A the early reflections result was confused with that of the late reflections, while for Room B the early reflections are clearly identified at the center of the screen, with different energy intensities. This phenomenon is mainly due to the volume sizes of the rooms where the surveys have been performed: the small dimensions of Room A create an overlap of the early and late reflections, causing the windowing process as difficult to be carried out; in Room B the volume size was large enough to make a distinction between all types of reflections, in line with the standard. Section 5 shows and comments on how the results in Room A have been compromised by the vertical walls, albeit minimally—an outcome that is considered successful for the tests performed in Room B.
Following the standard requirements, time windowing is a necessary process undertaken to select the early reflections related to each channel and discard the late or reverberant sound coming at a second stage. The windowing operation was implemented by using the software Adobe Audition 3.0. The plugin Aurora, suitable for all the versions of Adobe Audition, has been utilized to convert the sound wave from a time domain to a frequency domain through an FFT, in order to obtain all the sound levels at different frequencies and, hence, to calculate the diffusion coefficient.
To estimate the values of the absorption (α) and scattering (s) coefficients, a numerical model was required to compare the results. One of the assumptions applied to the model consists of the theoretical behavior that the digital entities should assume, to be considered ideal surfaces. This assumption is important to acquire an exhaustive comparison between the model and the curves obtained experimentally.
The construction of the theoretical model follows the rules described by literature in previous studies [19]. Given the sound levels at each band of frequency, as recorded by the 25 microphones, the absorption (α) and scattering (s) coefficients have been calculated by assuming the following:
  • The direct sound was calculated by following the theory of sound propagation in free field conditions, as indicated in Equation (5);
    L p = L w 10 L o g ( 4 π r 2 ) = L w 20 L o g ( r ) 11     [ dB ]
  • The reflected soundwave in the specular zone is obtained by the contribution of the specular reflected wave and the diffused reflected wave, as indicated in Equation (6);
    L d i f f + s p e c = L w 10 L o g ( ( S p a n e l 4 π r 1 2 )   ( 1 α ) s 2 π r 2 2 ) + 10 L o g ( ( 1 s ) ( 1 α ) 4 π ( r 1 2 + r 2 2 ) 2 )
  • The reflected soundwave out of the specular zone is given by the contribution of the diffuse energy only, as indicated in Equation (7).
    L d i f f + s p e c = L w 10 L o g ( ( S p a n e l 4 π r 1 2 )   ( 1 α ) s 2 π r 2 2 )
For the equations above, clarifications on nomenclature are required, in particular:
  • r 1 is the distance between the sample and the central microphone;
  • r 2 is the distance between the sample and the sound source.
S p a n e l is the surface area of the sample, in square meters. Equations (5)–(7) describe a theoretical model in function of α and s. This result allows for the construction of the reference curves at each band of frequency, based on the theoretical model explained above. Figure 6 shows the reference curve trend at 500 Hz based on the disposition of the microphones around the test sample.
The values of α and s have been considered when their results, describing a curve along all the 25 microphones, indicate little variations with respect to the theoretical model. It should be noticed that the reference curve is different for each frequency band, becoming narrower at high frequencies related to the noise levels centered on the microphones close to the sound source. Making the theoretical model as a reference curve, it is possible also to calculate the directional diffusion coefficient as one of the essential requirements of the standard ISO 17947-2: 2004. The procedure to obtain the directional diffusion coefficient ( d ϑ ) is described in Formula (8).
d ϑ = (   ( Σ i = 1 n 10 L i / 10 ) 2 Σ i = 1 n ( 10 L i / 10 ) 2 ( n 1 )   Σ i = 1 n ( 10 L i / 10 ) 2 )
where n is the number of microphones.

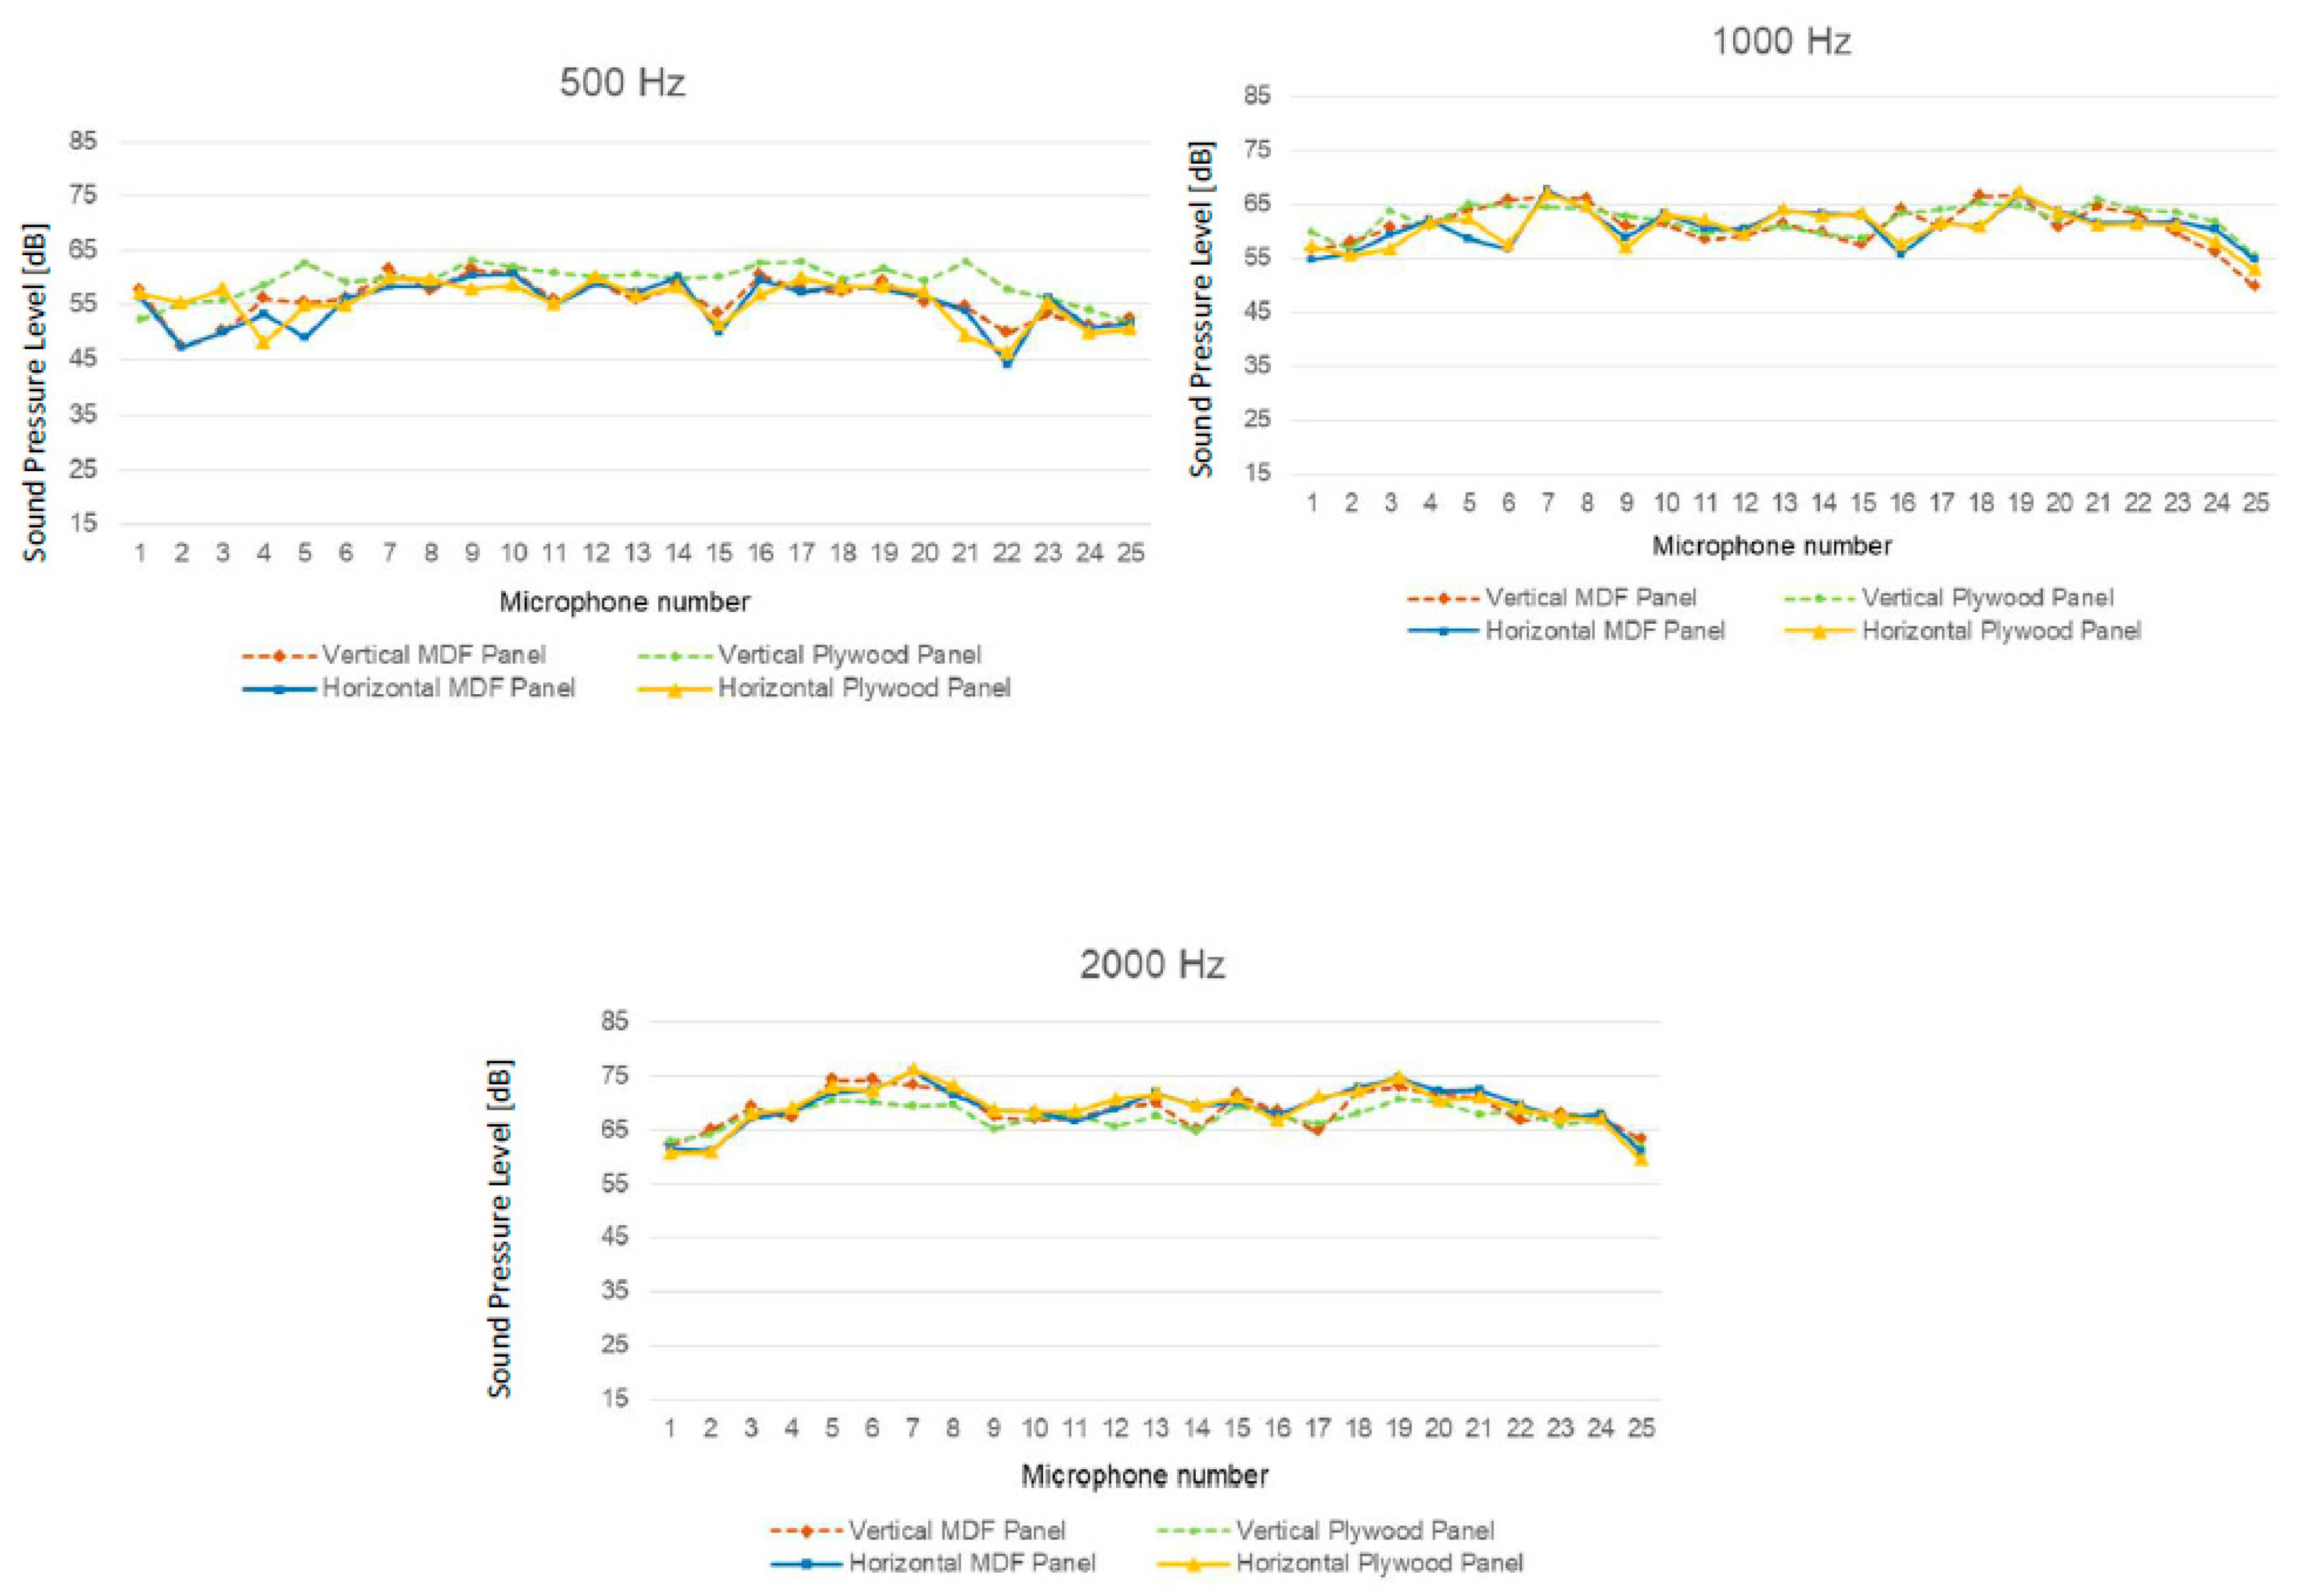
5. Results and Discussion

The test samples have been measured with the methodology described above. The following sections show the results relative to the diffusers tested inside Room A and Room B.

5.1. Measurement Results Undertaken inside Room A—Semi-Anechoic Room Facility at the SCM Group of Rimini

Diffusing panels made of two different materials (MDF and plywood) and reflecting panels are illustrated in Figure 7. The measurements of diffusing panels were repeated for different configurations, considering the panel in the horizontal and vertical orientation with a reflecting panel as the back. The analysis was carried out to evaluate the acoustic behavior and differences between diffusing panels made of MDF and plywood.
The graphs shown in Figure 8 represent the variation at the mid-frequencies range of sound pressure levels measured for the four panel’s configurations. From the results, it is possible to see that there is a slight difference between diffusing panels made of MDF and plywood and between the vertical and horizontal orientations.
Figure 9 reports the matching between numerical and experimental data for the Horizontal plywood and MDF panels. From the graphs, it is possible to note that the reflected energy captured by the side microphones (microphone 1 and 25) is far more than expected. Indeed, there is a slight difference between the sound pressure levels recorded by the central microphones and the lateral ones. This is not due to the ability of the panel to reflect a lot of lateral energy, but it might be caused by the small dimensions of Room A that have influenced the measurements, causing reflections able to slant the results. Therefore, we have verified that the semi-anechoic chamber in Rimini is not suitable for detecting the diffusion measurements and ensuring the free field conditions.

5.2. Measurement Results Undertaken inside Room B—Reverberant Room Facility at the University of Parma

Another set of measurements was performed inside Room B, a reverberant chamber that represents one of the laboratory facilities at the University of Parma. From the results in Section 5.1, the difference of the scattering coefficients between the QRD composed of plywood and MDF is minimal; as such, the authors for this campaign preferred to test the plywood QRD only, with and without the backing panel, in both horizontal and vertical configurations. As anticipated in Table 1, this campaign also consists of measuring the RIRs with the presence of the backing reflecting panel. This latest one has been introduced as a totally reflecting surface, representing a reference for making any comparison with the other configurations.
Figure 10 shows the plywood QRD that has been tested inside Room B, with and without the backing reflecting panel.
The graphs in Figure 11 report the scattering coefficient obtained for each band of frequency between 125 Hz and 8 kHz, and for the configurations of the plywood QRD described above. These results were compared to those obtained by testing the reflecting panel only. The results of the acoustical coefficients are obtained by considering the average values of all the measuring points related to each microphone.
At 125 Hz, all the configurations are similar and comparable, with a broad diffusion between channels 8 and 20. At the extremities, the peaks appear at channels 4 and 22, having a symmetrical trend with respect to channel 13 that is placed at the center.
The graph relative to 250 Hz shows an increase in sound levels at channels 11 and 16, with the best performance equal to 71 dB registered by measuring the plywood QRD with the backing reflecting panel. Other peaks are found at channels 4 and 22, with comparable sound levels recorded at 125 Hz. The downward peaks belong to channels 2, 7, 13, 19 and 24.
At 500 Hz, the sound level of channel 13, relative to the presence of the reflecting panel only, reaches 76 dB, equal to 5 dB above the plywood QRD in the horizontal configuration and with the backing reflecting panel. Other peaks are revealed at channels 9 and 17 with minor energy floating between 65 and 70 dB for all the configurations. The downward peaks recorded at 250 Hz, are herein increased up to 15 dB at the same channels.
The graph relative to 1 kHz shows a flatter trend of the results across all the microphones, with the elimination of the fluctuations registered at side channels. In particular, since the performance of the horizontal configuration with the backing reflecting panel resulted, in the best case, between 125 and 500 Hz, in this frequency band the vertical configuration with the backing reflecting panel gives higher sound levels, especially at channels 8 and 15, while at channel 13 the result is equal to the horizontal configuration having the backing panel.
From 2 kHz onwards, the performance of the only reflecting panel is the best only relative to channel 13, while it results lower than all the other configurations at the other microphone positions. The best performance across all the channels is given by the vertical configuration having the backing panel, especially at channel 13, but with small peaks registered at channels 7 and 20, recording 76 dB at these two positions.
The results at 4 and 8 kHz are very similar in trend line and maximum scattering sound energy, the only difference consists of the peaks registered at channels 7, 10, 12, 14, 16 and 18, resulting in the more accentuated at 8 kHz.
Other than the scattering coefficient, the directional diffusion coefficient has been calculated by the results obtained inside Room B. Figure 12 shows the values of the diffusion coefficient, correlated to the frequency range between 125 Hz and 8 kHz.
Among all the test samples and relative configurations tested in Room B, the specimen indicating the best performance of the diffusion coefficient is the plywood QRD in the vertical configuration, without any reflecting panel behind. In particular, the results indicate that the performance of d = 0.63 has been achieved at 1 and 2 kHz. The worst performance is given at 250 Hz and 8 kHz, with values of d floating between 0.23 and 0.22, respectively.
A second diffusion performance has been achieved by the plywood QRD in the horizontal configuration, without any reflecting panel behind. For this specific case, the highest value has been achieved with d = 0.55 at 1 kHz. A different trend line is obtained for this sample because a downward pick has been recorded at 2 kHz with d = 0.34.
The trend line similar to the latest sample has been registered for the plywood QRD in the vertical configuration, having the backing reflecting panel with slightly lower performance. The specimen that follows a different trend line is the reflecting panel tested by itself, having values around d = 0.10 from 1 kHz onwards.

5.3. Considerations upon Measurements’ Results Undertaken inside Room A and B

By the results, as commented in Section 5.1 and Section 5.2, it has been shown that the values of the scattering coefficient, related to the measurements undertaken inside Room A, are consistently high. This is due to the microphones that have recorded much more reflected sound energy than what was expected. This phenomenon has been created by the small distance between the microphones and the vertical walls of the room, whose reflected energy has been overlapped with the sound energy scattered by the QRD. This statement is confirmed by the concentration of sound energy in the corners of the room, related to microphone positions 1 and 25.
In summary, the values registered by the tests performed inside Room A should not be subject to consideration, because they were impacted by extraneous factors not related to the samples.
The results obtained by testing the panels inside Room B are considered valid because the samples were tested in an appropriate environment in accordance with the guidelines. The differences between the measurements undertaken in Room A and B are shown by the graphs in Figure 13, related to the same sample (i.e., plywood QRD in the horizontal configuration, without any backing reflecting panel).
Figure 13 shows that the scattering coefficients in Room A have comparable levels at 500 Hz across all the microphones, with downward peaks up to 10 dB, related to channel 4 and 22. Results obtained in Room B indicate a noticeable difference of up to 15 dB between the central channels (8 to 19) and the laterals, approximating the reference curve of the theoretical model introduced in Section 6. A similar trend has been found in the graph related to 2 kHz, where the central channels of Room B revealed higher sound energy than that tested in Room A, while the values obtained at the lateral channels (i.e., 1 to 7, and 19 to 25) are very comparable.
Curves indicated in the graph related to 1 kHz accentuate the difference between the results obtained in Room A and B, including the lateral channels for a level difference comprised between 10 and 15 dB.
The graph in Figure 14 reports the comparison among the Horizontal Plywood Panel with back, tested in Room A and Room B. The light blue line reports the values of the reflecting panel (alone), whilst the dotted line reports the scattering coefficient values of the Horizontal Plywood Panel without reflecting panel tested in Room B. From the graph, the Horizontal Plywood Panel—Room B scattering coefficient (dotted line) resulted higher than 0.4 for all the frequencies, except for 250 and 125 Hz, while for the other frequencies the scattering coefficient increases with increasing frequency. The values obtained for the Horizontal Plywood Panel with back—Room A gave inconsistent results due to the size of Room A.

6. Conclusions

Measurements were undertaken on the popular QRD in two specific configurations: horizontal and vertical disposition of the wells, placed with a rigidly backed smooth panel. Following part 2 of the reference standard (ISO 17497), the measurements consisted of placing the samples at the center of a virtual concentric arch of evenly spaced 25 microphones. The microphones’ positions ranged from θ = 0 ° to θ = 90 ° with a spacing of 7.5° between each other and along a semicircle. This configuration has been employed in two rooms of different volume sizes and characteristics of wall finishes: a semi-anechoic chamber available at SCM Group in Rimini (Room A) and a reverberant laboratory available at the University of Parma (Room B).
Other than the physical features of the two testing rooms, the measurements differed in the radius dimension of the virtual semicircle, where the samples were placed at the center: r = 4 m for Room A, r = 5 m for Room B. The choice of testing inside a semi-anechoic chamber, although considered too narrow for carrying this type of test, fell by keeping unwanted acoustical contributions from the vertical walls, while the concern of the floor reflections was solved by disposing of microphones on the floor. Although very minimal, the contribution of extraneous reflections inside Room A compromised the results of the scattered sound from the panels, which should be discarded because they cannot be compared with the affordable values obtained in Room B. This outcome would be considered a challenge when trying to undertake a data analysis where the conditions are not favorable. On this basis, the best solution was to discard the results not in line with the procedure, as outlined by the standard requirements.
The results of panels tested inside Room B instead were compared with the reference curves of a theoretical model based on the theory of sound propagation in free field conditions, and data analysis consisted of a polar distribution of the scattered field through the use of the Fast Fourier Transform (FFT). A final calculation related to the diffusion coefficients of the selected panels in the specific configurations has been carried out for the frequency range comprised between 125 Hz and 8 kHz.
This paper would like to highlight the attention given to the correct procedure outlined by the regulations to be followed for a successful data output, which, instead, would be compromised by extraneous factors that should not be in place.

Author Contributions

Conceptualization, L.T. and A.F.; methodology, L.T. and A.F.; software, F.M.; validation, A.B.; formal analysis, L.T. and A.F.; investigation, P.F.; resources, L.T.; data curation, F.M. and P.F.; writing original draft preparation, A.B.; visualization, A.B. and P.F. All authors have read and agreed to the published version of the manuscript.

Funding

This work was carried on within the project “SIPARIO-Il Suono: Arte Intangibile delle Performing Arts—Ricerca su teatri italiani per l’Opera POR-FESR 2014-20”, n. PG/2018/632038, funded by the Regione Emilia Romagna under EU Commission.

Institutional Review Board Statement

Not applicable.

Informed Consent Statement

Not applicable.

Conflicts of Interest

The authors declare no conflict of interest.

References

  1. Hodgson, M. Evidence of diffuse surface reflections in rooms. J. Acoust. Soc. Am. 1991, 88, S185. [Google Scholar] [CrossRef] [Green Version]
  2. Embrechts, J.-J. A geometrical acoustics approach linking surface scattering and reverberation in room acoustics. Acta Acust. United Acust. 2014, 100, 864–879. [Google Scholar] [CrossRef]
  3. Embrechts, J.-J. An analytical model for reverberation energy decays in rooms with specular and diffuse reflections. J. Acoust. Soc. Am. 2019, 145, 2724–2732. [Google Scholar] [CrossRef] [PubMed]
  4. Tronchin, L.; Merli, F.; Manfren, M.; Nastasi, B. The sound diffusion in Italian Opera Houses: Some examples. Build. Acost. 2020, 27, 333–355. [Google Scholar] [CrossRef]
  5. Bibby, C.; Hodgson, M. Characterization and improvement of absorption and scattering by profiled architectural surfaces without specialized test facilities. Appl. Acoust. 2011, 72, 889–898. [Google Scholar] [CrossRef]
  6. Cox, T.J.; D’Antonio, P. Acoustic Absorbers and Diffusers: Theory, Design and Application, 2nd ed.; CRC Press: New York, NY, USA, 2009. [Google Scholar]
  7. Kuttruff, H. Room Acoustics, 3rd ed.; CRC Press: London, UK, 2016. [Google Scholar]
  8. Schroeder, M.R. Binaural dissimilarity and optimum ceilings for concert halls: More lateral sound diffusion. J. Acoust. Soc. Am. 1979, 65, 958–963. [Google Scholar] [CrossRef]
  9. Cox, T.J. The optimization of profiled diffusers. J. Acoust. Soc. Am. 1995, 97, 2928–2936. [Google Scholar] [CrossRef] [Green Version]
  10. Takahashi, D. Development of optimum acoustic diffusers. J. Acoust. Soc. Jpn. 1995, 16, 51–58. [Google Scholar] [CrossRef] [Green Version]
  11. Cox, T.J.; Dalenback, B.-I.L.; D’Antonio, P.; Embrechts, J.J.; Jeon, J.Y.; Mommertz, E.; Vorländer, M. A tutorial on scattering and diffusion coefficients for room acoustic surfaces. Acta Acust. United Acust. 2006, 92, 1–15. [Google Scholar]
  12. Hargreaves, T.J.; Cox, J.T.; Lam, Y.W.; D’Antonio, P. Surface diffusion coefficients for room acoustics: Free-field measures. J. Acoust. Soc. Am. 2000, 108, 1710–1720. [Google Scholar] [CrossRef] [PubMed]
  13. Choi, Y.-J.; Jeong, D.-U. Some issues in measurement of the random-incidence scattering coefficients in a reverberation room. Acta Acust. United Acust. 2008, 94, 769–773. [Google Scholar] [CrossRef] [Green Version]
  14. AES-4id-2001. AES information document for room acoustics and sound reinforcement systems—Characterization and measurement of surface scattering uniformity. J. Audio Eng. Soc. 2001, 49, 148–165. [Google Scholar]
  15. Vorländer, M.; Mommertz, E. Definition and measurement of random-incidence scattering coefficients. Appl. Acoust. 2000, 60, 187–199. [Google Scholar] [CrossRef]
  16. Vorländer, M.; Embrechts, J.-J.; De Geetere, L.; Vermeir, G.; De Avelar Gomes, M.H. Case studies in measurement of random incidence scattering coefficients. Acta Acust. United Acust. 2004, 90, 858–867. [Google Scholar]
  17. ISO 17497-1:2004. Acoustics—Sound-Scattering Properties of Surfaces—Part 1: Measurement of the Random-Incidence Scattering Coefficient in a Reverberation Room; Organisation Internationale de Normalization: Geneva, Switzerland, 2004. [Google Scholar]
  18. ISO 17497. Acoustics—Sound-Scattering Properties of Surfaces—Part 2: Measurement of the Directional Diffusion Coefficient in a Free Field; Organisation Internationale de Normalization: Geneva, Switzerland, 2012. [Google Scholar]
  19. Farina, A. A new method for measuring the scattering coefficient and the diffusion coefficient of panels. Acta Acust. United Acust. 2000, 86, 928–942. [Google Scholar]
  20. Ballestero, E.; Jimenez, N.; Groby, J.P.; Dance, S.; Ayugun, H.; Romero-Garcia, V. Experimental validation of deep-subwavelength difusión by acoustic metadiffusers. Appl. Phys. Lett. 2019, 115, 081901. [Google Scholar] [CrossRef]
  21. ISO 354. Acoustics—Measurement of Sound Absorption in a Reverberation Room; Organisation Internationale de Normalization: Geneva, Switzerland, 2003. [Google Scholar]
  22. ISO 18233. Acoustics—Application of New Measurement Methods in Building and Room Acoustics; Organisation Internationale de Normalization: Geneva, Switzerland, 2006. [Google Scholar]
Figure 1. Quadratic residue diffuser (QRD) used during the experimental measurements: (a) elevation; (b) horizontal section; (c) vertical section. All the numbers are in mm.
Applsci 11 10523 g001
Figure 2. Equipment disposition inside the semi-anechoic chamber available at SCM Group in Rimini (Room A).
Applsci 11 10523 g002
Figure 3. Equipment disposition inside the reverberant laboratory of the University of Parma (Room B).
Applsci 11 10523 g003
Figure 4. Example of a polar plot of RIR data measured inside Room A: direct sound on the left and reflected sound in the center.
Applsci 11 10523 g004
Figure 5. Example of a polar plot of RIR data measured inside Room B: direct sound on the left, early reflections in the center and late reflections on the right.
Applsci 11 10523 g005
Figure 6. Curve trend of the theoretical model at 500 Hz.
Applsci 11 10523 g006
Figure 7. Diffusing panels made of MDF (a), plywood (b), and reflecting panel (c) tested inside the semi-anechoic chamber in SCM company in Rimini (Room A).
Applsci 11 10523 g007
Figure 8. Results for the four panel’s configurations tested inside Room A at mid-frequencies.
Applsci 11 10523 g008
Figure 9. Matching between numerical and experimental data for the horizontal plywood and MDF panels inside Room A at mid-frequencies.
Applsci 11 10523 g009
Figure 10. Plywood QRD tested in Room B, with (a) and without (b) the backing reflecting panel, in the horizontal configuration.
Applsci 11 10523 g010
Figure 11. Plywood QRD tested with and without the backing reflecting panel, in horizontal and vertical configurations.
Applsci 11 10523 g011
Figure 12. Directional diffusion coefficient related to the samples tested inside Room B.
Applsci 11 10523 g012
Figure 13. Comparison of the scattering coefficient based on measurements undertaken inside Room A and B.
Applsci 11 10523 g013
Figure 14. Comparison of the scattering coefficient based on measurements undertaken inside Room A and B (“Coeff. Scattering Horizontal Plywood Panel–Room B” = “Horizontal plywood panel with back-room B”–“Refecting panel”).
Applsci 11 10523 g014
Table 1. Test performance organized in Room A and B.
ConfigurationRoom ARoom B
Empty RoomTestedTested
Only reflecting panel-Tested
Only MDF QRD—Vertical--
Only MDF QRD—Horizontal--
MDF QRD with backing refl. Panel—VerticalTested-
MDF QRD with backing refl. Panel—HorizontalTested-
Only Plywood QRD—Vertical-Tested
Only Plywood QRD—Horizontal-Tested
Plywood QRD with backing refl. Panel—VerticalTestedTested
Plywood QRD with backing refl. Panel—HorizontalTestedTested
Publisher’s Note: MDPI stays neutral with regard to jurisdictional claims in published maps and institutional affiliations.

